
Congratulations to our friends at The Lillys on their third incarnation of this work, an ongoing study created in partnership with The Dramatists Guild.
from The Lillys website:
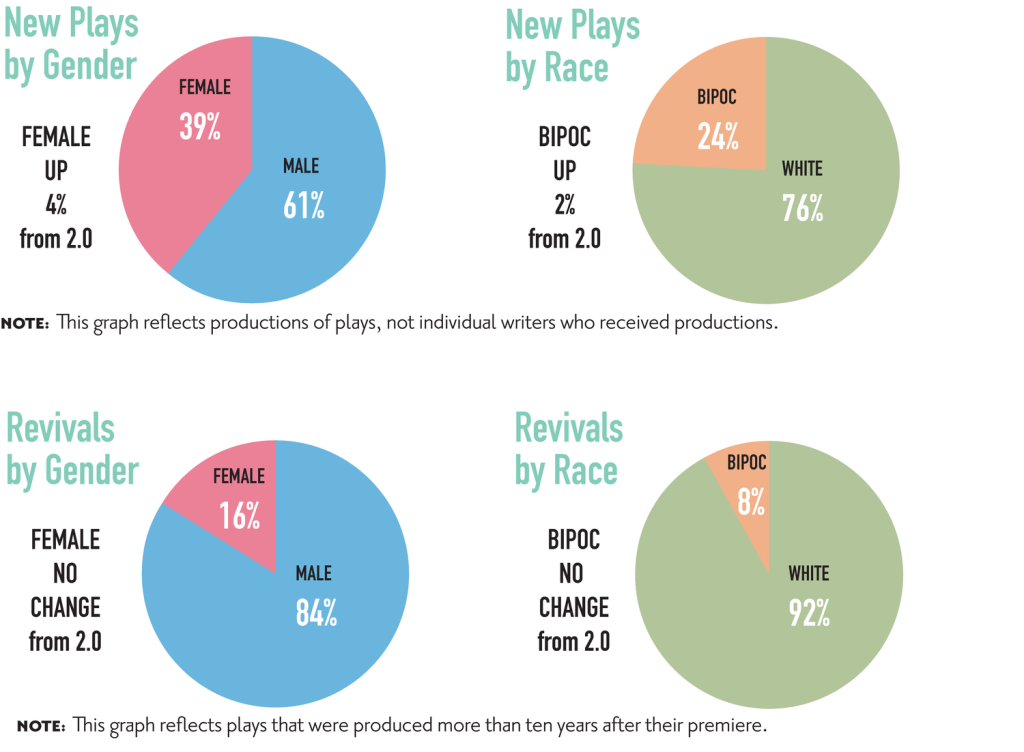
The Count 3.0 gathered production data from a diverse sample of 147 not-for-profit theaters nationwide as chosen by The Dramatists Guild regional representatives. The focus is on theaters that produce contemporary work. The Count studies gender, race, and nationality of the creators of plays and musicals. Due to the size of the data set and intersectionality, we could only reliably break down race into two groups, BIPOC and white. The Count collects national statistics and breaks them down by region and city. Findings are presented in three-year installments, in hopes of creating a dynamic record of change over time.
In this third installment and ninth year of this project, it’s clear that, although the American theater has continues to add to the diversity of its playwrights, neither gender nor racial parity has yet been achieved in terms of production. Anecdotally, it appears that women over the age of 50, especially BIPOC women, who led the push for the diversity we now enjoy, do not appear to have directly benefitted. As information on playwrights’ ages is not widely available, we cannot show national statistics. The Lillys has begun a study of the stages of NYC, and will announce our findings in the near future.
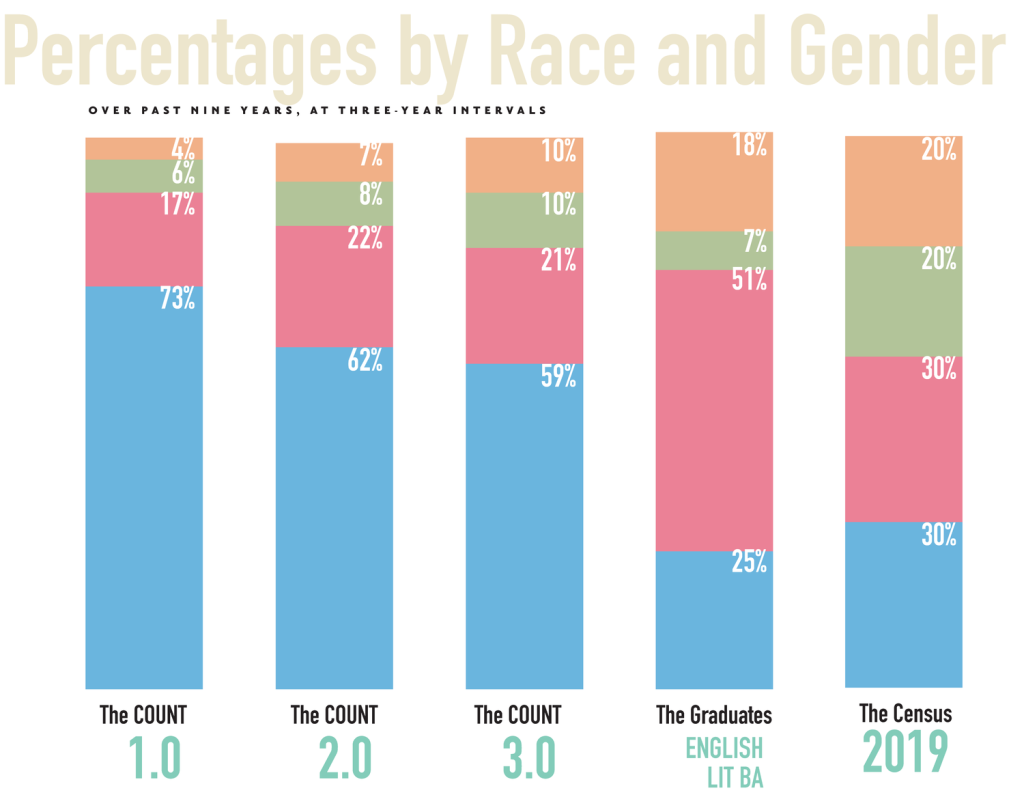

In this study, “white” is defined as those self-identifying as “white alone, not Hispanic or Latino.” The U.S. Census also explicitly defines white as “original peoples of Europe, North Africa, or the Middle East.” For purposes of fair comparison, apples to apples, The Count has adopted that definition.
The U.S. Census has not included trans or non-binary as gender identity choices thus far. The most widely cited estimate of that population comes from a single 2016 study from The Williams Institute at UCLA, that placed the population at, at least, .5%. As more people self-identify, their numbers will obviously climb. We began actively looking for self-identification in The Count 2.0
The education statistics were taken from The National Center for Education Statistics (NCES) of the U.S. Department of Education. It represents those who graduated with B.A. in English Literature in the years 2010-2011. It is important to note that women dominating the literature departments is not a new phenomenon. White and BIPOC women have held the majority of English Literature B.A. degrees since the 1960s.
We are no longer formally tracking B.A. in Performing Arts because the NCES conflates their numbers with Visual Arts. However, for those interested, the findings are similar. In 2010-2011, white women earned 45%, white men earned 28%, BIPOC women earned 16% and BIPOC men earned 11%.

Philadelphia produced the lowest percentage of women in The Count 2.0, followed by the highest percentage in 3.0, as well as the highest in the history of The Count.
Seattle produced the second-lowest percentage of women in The Count 2.0, followed by the second-largest gain in 3.0.
D.C’s Women’s Voice Theater Festival has not resulted in a higher percentage of women produced in that city compared to other cities that did not conduct similar festivals. It did, however, garner national media coverage and bring attention to the issues of underrepresentation.
Philadelphia also nearly doubled its percentage of produced BIPOC writers, and Seattle did double theirs, though both cities remain towards the bottom of our list.
NYC posted the largest gain at 11%, which moved it from the middle of the pack to the top.
Kansas City has a smaller number of theaters included in The Count compared to other cities, which may partially explain the large fluctuation in its percentages.